Roof Zone Mapping
Capability
A labeled roof zone diagram is the foundation document for every inspection report, every repair scope, and every warranty conversation. Without one, you are describing roof conditions in words that mean different things to different people.
Roof zone mapping is one of the most unglamorous and most useful things we do. Every building in our system has a zone diagram — a scaled plan of the roof with field, perimeter, and corner zones defined per Florida Building Code and ASCE 7 wind-pressure designations, every drain labeled and numbered, every HVAC curb and penetration labeled, every parapet and interior wall labeled, and every expansion joint marked. It takes a few hours to produce for a new building. It is the reference document that every inspection report, every repair work order, and every warranty conversation uses for the next 20 years.
In Central Florida, the FBC wind-pressure zone classification is not just administrative — it drives actual specification decisions. The corner zones of a commercial building in Orange County are designed to higher wind-uplift pressures than the field zone. If a repair scope does not specify the zone it is in, the repair may not be fastened to the correct FBC attachment pattern. An inspection deficiency that does not identify the zone cannot be located by the repair crew or by the manufacturer's warranty inspector without re-walking the roof.
Roof scope notes
We produce zone diagrams for every building we take on — during the onboarding for our asset management program, as part of the initial condition assessment, or as a standalone service for building owners who want to establish the document without a full inspection. The diagram is delivered in PDF format with labeled locations and in a layered format that can be annotated in the field.
FBC Wind-Pressure Zone Definitions for Orlando Commercial Roofs
Florida Building Code Chapter 15 and ASCE 7-22 define three roof pressure zones for commercial low-slope roofs: the field zone (Zone 1), the perimeter zone (Zone 2), and the corner zone (Zone 3). Each zone carries a higher design uplift pressure than the interior zone, reflecting the turbulence and vortex effects that develop at roof edges and corners under wind loading.
For a typical 30-foot-tall commercial building in Orlando's Wind Speed map zone (approximately 130 mph 3-second gust at OIA), the design pressures run roughly -25 to -30 psf in the field, -45 to -55 psf in the perimeter zones, and -65 to -85 psf in the corner zones — numbers that drive significantly different fastener patterns and attachment densities in each zone. A zone diagram for an Orlando commercial building maps the physical boundaries of these zones on the actual roof plan, so that the specification for each zone can be applied correctly during installation and verified during inspection.
Buildings on the east and northeast exposure to Lake Eola, buildings in the Kissimmee Valley area where open terrain extends the effective wind exposure, and buildings on International Drive near the elevated topography around the conventions center all have exposure considerations that affect the zone boundaries. We calculate exposure category and zone boundaries from the building's actual location and surrounding terrain, not from a generic template.
What the Zone Diagram Labels
Roof zone boundaries: Field, perimeter, and corner zones with dimensions from the building edge per ASCE 7 — the perimeter zone width is a function of the smaller of the building's horizontal dimension or its eave height, so it varies by building geometry. We calculate these dimensions and draw them on the plan.
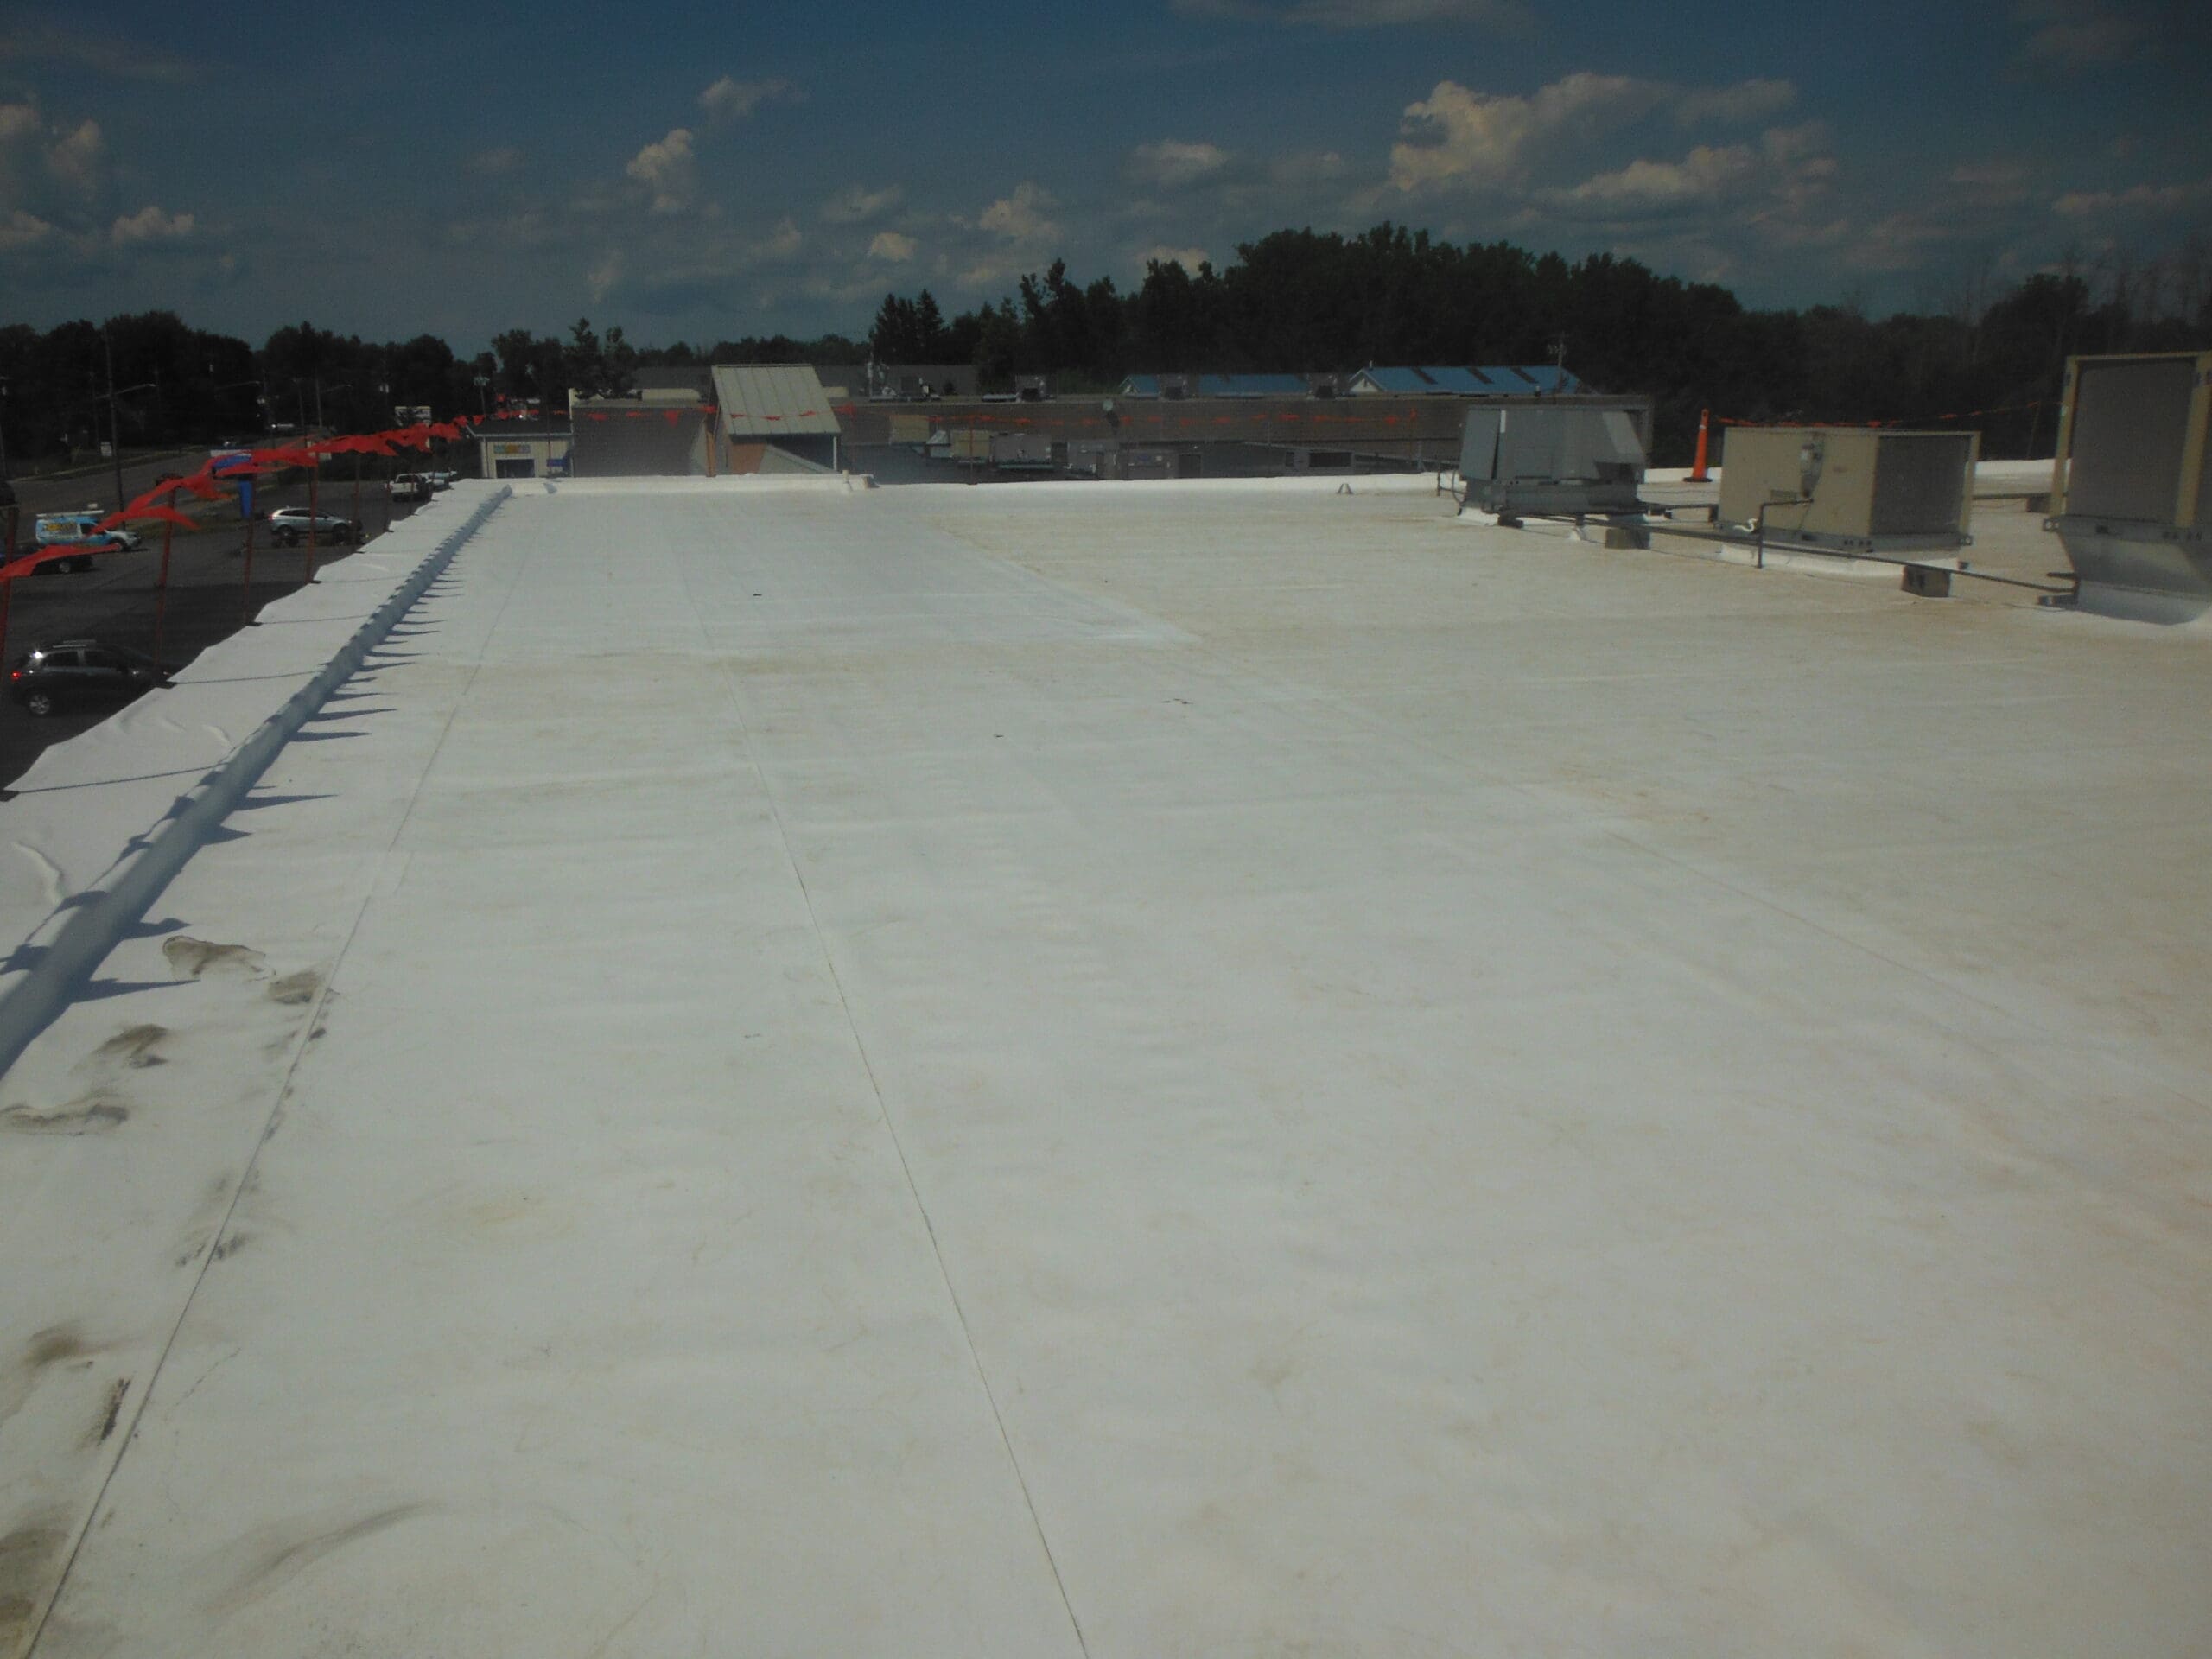
Drains: Every drain is labeled (D-1, D-2, etc.) with its approximate area of contribution and condition noted in the inspection report. Orlando building drain layouts are the most important planning document for understanding ponding risk — the zone diagram shows us immediately whether the drain layout matches the roof's geometry or whether certain areas are effectively draining away from the drains.
HVAC curbs and equipment: Every HVAC curb, unit, pipe penetration, skylight curb, vent, and equipment pad is labeled. The curb count and location matters for scheduling — replacing a roof under 30 HVAC curbs requires a different production sequence than replacing a roof with 8 curbs. Knowing the locations before the project starts means we plan the curb-flashing work into the critical path, not as an afterthought.
Zone Diagrams for Multi-Building Portfolios
For portfolio owners managing multiple buildings across the Orlando metro, a standardized zone diagram format across all buildings is the difference between a portfolio management system and a collection of building-specific records that cannot be compared. We produce zone diagrams in a consistent format across all buildings in a portfolio, with a consistent labeling convention that a facilities team can navigate without re-learning the system for each building.
We have produced zone diagram sets for hotel portfolios on International Drive where 15-25 buildings share a consistent format, for office park owners in the Maitland and Sand Lake Road corridors managing 10-20 buildings on a single asset management contract, and for medical office operators in the Lake Nona area managing buildings across multiple campuses. A portfolio zone diagram set is the foundational document that makes portfolio-level condition reporting and capital planning possible.
The zone diagrams we produce are property of the building owner. They are not proprietary to our engagement. If the building owner changes contractors, the zone diagram goes with the building — it is a building record, not a contractor marketing document. We include this provision in every engagement because zone diagrams should be maintained for the life of the building, not lost when a contractor relationship changes.
What if my building does not have any existing roof diagrams?
That is the most common situation we encounter when onboarding a new building. We produce the initial zone diagram from a field measurement walk — we measure the roof perimeter, locate all drains and penetrations, calculate the FBC zone boundaries, and produce the diagram from our field data. For large or complex buildings, we can also work from the building's existing floor plan if it is available and accurate.
Can you update zone diagrams for buildings that have been modified or expanded?
Yes. Buildings with roof additions, new equipment installations, new drain locations, or modified parapet configurations need updated zone diagrams to reflect the current state. An outdated diagram that does not reflect a 2015 roof addition is worse than no diagram because it creates false confidence. We update zone diagrams as part of the inspection process whenever we identify that the building has changed from the current diagram.
What format do you deliver zone diagrams in?
We deliver zone diagrams in PDF format, which is universally accessible, and in a layered DWG or SVG format on request if the building's facilities team has the software to work with it. The PDF version includes the labeled zone boundaries, drain labels, penetration labels, and the zone area calculations. Most facilities teams use the PDF version for field reference and for inclusion in inspection reports.
How often should zone diagrams be updated?
Update the zone diagram any time the roof geometry, equipment layout, or drain locations change. Annual inspection walks are a good opportunity to verify that the current diagram matches the current roof — in practice, HVAC units get added and removed, penetrations are added for new systems, and parapet configurations change with building modifications. We flag any discrepancy between the current diagram and current field conditions during each inspection walk.
Keep comparing the scope.

Commercial Roof Bid Coordination in
Structured competitive bid coordination for Orlando commercial roof projects — bid-package preparation, contractor qualification, scope leveling, and...
Commercial Roof Inspections
Documented commercial roof inspections for Orlando-area buildings — condition reports, drain assessment, FBC compliance status, and photo logs keyed...
Commercial Roof Life-Cycle Cost Analysis
Life-cycle cost analysis for Orlando commercial roof decisions — total cost of ownership modeling for replacement, recover, and coating options...